|
navigation
consulting
services
training
services
specials
reading
material
resources
|
The 6-Sigma methodology provides the tools to improve the capability of business processes, increasing their performance and decreasing their variability.
This leads to defect reduction and improvement in profits, employee morale and quality of product.
Six Sigma utilises information (management by facts) and statistical analysis to measure and improve an enterprise's operational performance, practices and systems.
The objective of Six Sigma Quality is to reduce process output variation.
Many processes are likely to being influenced by special and/or assignable causes that impact the overall process' performance relative to the customer's specification (or expectations).
The Six Sigma methodology targets at: understanding variation - measuring variation - reducing variation - monitoring variation.
basic definitions
- Sample: a group of units, portion of material, or observation taken from a larger collection of units, quantity of material, or observations. A Sample serves to provide information that may be used as a basis for making a decision concerning the larger quantity (Population).
Example:
SuperBank Ltd. want to know what is the mean Customer Waiting Time for a Teller.
To this purpose, a Sample is chosen as a group of 20 Customers cueing on Day dd/mm/yyyy as from 09:30 a.m.
The total Population of Customers on the dd/mm/yyyy cueing for a Teller was 189.
- Distribution: a set of numbers collected from a well-defined universe of possible measurements arising from a property or a variable or a relationship under study.
Example:
Customer Waiting Time in minutes at Teller queue
(SuperBank Ltd. - Day: dd/mm/yyyy - 9:30am - Sample: 20 customers)
1,00 1,25 1,45 1,75 2,00 2,00 2,00 2,15 2,15 2,15
2,15 2,15 2,15 2,45 2,45 2,75 2,75 2,90 3,00 3,35
- Mean: a measure of the location of a Distribution. The so-called "Centroid". For a number N of variables xi the Mean is

Example:
The "mean" Customer Waiting Time at SuperBank Ltd. on that Day, at that Time, and for that Sample of Customers was
(1,00+1,25+1,45+1,75+2,00+2,00+2,00+2,15+2,15+2,15+2,15+2,15+
2,15+2,45+2,45+2,75+2,75+2,90+3,00+3,35) / 20 = 2,20 minutes
- Mode: the most frequent Value of a variable in a Distribution
Example:
Customer Waiting Time in minutes at SuperBank Ltd.
Distribution:
1,00 1,25 1,45 1,75 2,00 2,00 2,00 2,15 2,15 2,15
2,15 2,15 2,15 2,45 2,45 2,75 2,75 2,90 3,00 3,35
Mode = 2,15 minutes (6 times)
- Range: is a measure of "dispersion" which is the difference between the largest observed value and the smallest observed value in a given Sample.
Example:
Customer Waiting Time in minutes at SuperBank Ltd.
Distribution:
1,00 1,25 1,45 1,75 2,00 2,00 2,00 2,15 2,15 2,15
2,15 2,15 2,15 2,45 2,45 2,75 2,75 2,90 3,00 3,35
Range = xmax - xmin = 3,35 - 1,00 = 2,25 minutes
NB: to understand process' variation, mean and mode are often meaningless, and the range may be misleading
- Standard Deviation σ: a significant measure of variability.
The standard deviation of a set of N sample's values is a measure of variation of values about the mean, and is defined by the following formula:

Example:
Customer Waiting Time in minutes at SuperBank Ltd.
Standard Deviation from the mean = 0,57 minutes
Example of practical use of Standard Deviation.
SuperBank want to compare their Teller Process Performance with that of their competitor, BankExtra Ltd.
An observer records ("incognito") the following values of Customer Waiting Time in the same Day as from the same Time (9:30 am):
1,85 1,85 1,95 1,95 2,00 2,05 2,10 2,15 2,15 2,15
2,15 2,20 2,25 2,30 2,35 2,40 2,45 2,55 2,55 2,60
The mean is the same: 2,2 minutes
The mode is the same: 2,15 minutes (4 times)
The range is lower: 0,75 minutes (compared to 2,25 minutes of S.Bank)
The Standard Deviation is lower: 0,22 minutes (or 40% of that of Superbank)
If the exercise would be extended to consider:
- Different Days of the week
- Different Times of the Day
- A wider Sample of Customers' Waiting Time
and the results of the exercise would be the same as in the example, the net conclusion is that ExtraBank Customers stand a high chance (more than double) to wait less for a Teller transaction than SuperBank Customers - in spite of the "average" Waiting Time being the same in the 2 cases (the 2 Banks have the same measures of central tendency).
This means that the "Carrying-out-a-Teller-transaction" process at BankExtra is more "stable" than at SuperBank (for a number of contributing factors). Which Bank would you choose?
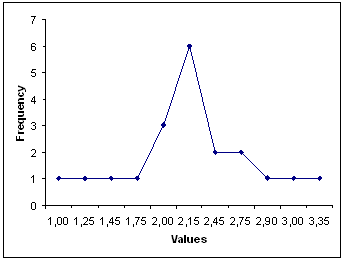
Graphic representation of a Distribution
Customer Waiting Time in minutes at Teller queue
(SuperBank Ltd. - Day: dd/mm/yyyy - 9:30am - Sample: 20 customers)
1,00 1,25 1,45 1,75 2,00 2,00 2,00 2,15 2,15 2,15
2,15 2,15 2,15 2,45 2,45 2,75 2,75 2,90 3,00 3,35
- Normal Distribution (Gaussian Distribution): this is the most common continuous Distribution encountered in Six Sigma projects.
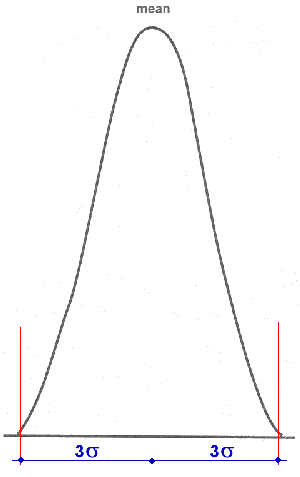
When the probability density function (frequency) of the Distribution data (values) is plotted, the graphical result is the well-known "bell curve" (normal/Gaussian curve):
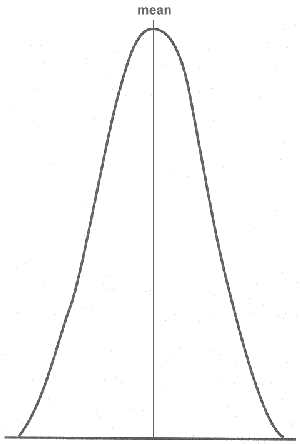
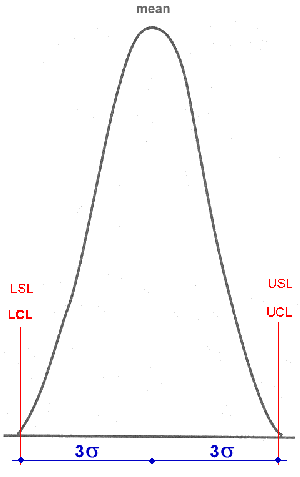
An interesting property of the normal curve is the 3σ rule:
The % of data with values falling between the mean and +-3σ is 99,73%
This means that all values of a normal curve, except a very negligible %, fall in an interval 6 σ wide, and centred on the mean.
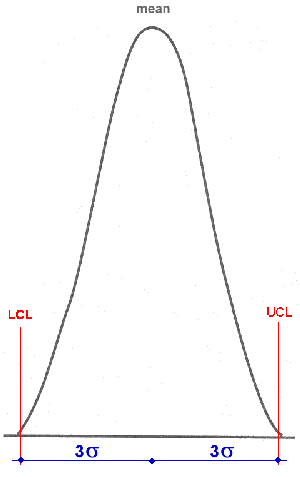
- Control Limits: define the area three standard deviations on either side of the centre-line, or mean, of data plotted on a control chart.
Control limits reflect the expected variation in the data.
Generally, we consider a Lower Control Limit and an Upper Control Limit.
- Specification: a criterion that is to be met by a part, or a product, or any feature of a process. Limits may be associated to Specifications. There may be a Lower Specification Limit and an Upper Specification Limit.
Example:
Customer Waiting Time in minutes at SuperBank Ltd.
SuperBank may decide to establish, as a target, that Customer Waiting Time at SuperBank Tellers should not exceed 1,75 minutes.
That becomes a specification.
Any Waiting Time longer than 1,75 minutes would fall out of specifications. 1,75 minutes is the Upper Specification Limit.
Understanding: Defect, Unit and Opportunity
Every process should have definitions for defect, unit and opportunity
First: understand the needs of process' customers (listen to the voice of the customer…..). This means a QFD (Quality Function Deployment) approach: gather customer comments/quotes and translate them into issues and specifications.
These are the Customer's CTQs (Critical To Quality) or a product or service characteristic that must be met to satisfy a customer specification or requirement.
more definitions
- Defect: a departure of a quality characteristic from its intended level or state that occurs with a severity sufficient to cause an associated product or service not to satisfy intended normal, or reasonably foreseeable, usage requirements. [T. Pyzdek]
A defect is a failure to conform to requirements' whether or not those requirements have been articulated or specified.
In practice, a defect is defined as any part of a product or service that:
- does not meet customer specifications or requirements, or
- causes customer dissatisfaction, or
- does not fulfil the functional or physical requirements
A failure to meet one of the acceptance criteria or Specifications is a Defect. A Defect corresponds to falling out of Specification Limits (Lower or Upper).
- Unit: a feature that can be quantified by a customer. It is a measurable and observable output of a process. It may manifest itself as a physical unit or, if a service, it may have specific start and stop points.
- Opportunities: the total number of chances per unit to have a defect. Each opportunity must be independent of other opportunities and, like a unit, must be measurable and observable. The final requirement of an opportunity is that it directly relates to the customer CTQ. The total count of opportunities indicates the complexity of a product or service.
- CTQ (Critical to Quality): key measurable characteristics of a product or process whose performance standards or Specification Limits must be met in order to satisfy the customer. They align improvement or design efforts with customer requirements.
CTQs represent the product or service characteristics that are defined or expected by the customer (internal or external). They may include the Upper and Lower Specification Limits or any other factors related to the product or service. A CTQ usually must be translated from a qualitative customer statement or verbatim into an actionable, quantitative business Specification.
In a nutshell, CTQs are what the customer expects of a product or a service... the spoken or unspoken needs/expectations of the customer.
Example:
SuperBank Ltd. Customer Waiting Time at Tellers
CTQ Specification: Waiting Time not to exceed 1,75 minutes
Defect: Any Waiting Time longer than 1,75 minutes
Unit: Time (waiting, in the cue)
Opportunity: Any Customer of the Bank cueing at Tellers (all Bank Customers)
1,00 1,25 1,45 1,75 2,00 2,00 2,00 2,15 2,15 2,15
2,15 2,15 2,15 2,45 2,45 2,75 2,75 2,90 3,00 3,35
(defects are in red/italic)
- Process Yield: is calculated by subtracting the total number of Defects from the total number of Opportunities, dividing by the total number of Opportunities, and finally multiplying the result by 100.
Example:
SuperBank Ltd. Customer Waiting Time at Tellers
1,00 1,25 1,45 1,75 2,00 2,00 2,00 2,15 2,15 2,15
2,15 2,15 2,15 2,45 2,45 2,75 2,75 2,90 3,00 3,35
Defects: 16
Opportunities: 20
Process Yield = 100 * (20 - 16)/20 = 20%
(only 20% Customers' Waiting Times falling within Specifications)
the six sigma vs. traditional methodology
Under the traditional Quality methodology, a process is defined as "capable" (performing) and "normal" if a process parameter's natural "spread" (plus and minus three sigma from the Mean) is less than the engineering admitted tolerance.
This is like to say that the Lower and Upper Specification Limits are coincident with the "natural" Control Limits of the process' parameter expected variation.
Under this traditional assumption of "normality", this three sigma Quality Level corresponds to a Process Yield of 99,73%. Hence:
Process Defects = 2700 per Million
Motorola contributed very significantly to the issue, changing the approach to quality from measuring defects in percent (defective parts per hundred) to measuring defects in ppm - parts per million (and even billions).
Which is what modern business requires: near perfect quality levels (or zero defects).
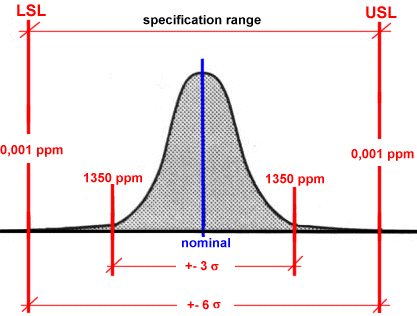
The Six Sigma methodology requires that processes operate such that the Specification Limits are at list six sigma (+ -) from the process Mean.
With a "centred" Normal Distribution within 6 sigma Specification Limits, only 2 PPB (parts per billion) fail to meet the target.
When the Distribution is "centred":
|
Spec. Limit
|
Yield %
|
Defective PPM
|
|
+- 1 sigma
|
68,27
|
317300
|
|
+- 2 sigma
|
95,45
|
45500
|
|
+- 3 sigma
|
99,73
|
2700
|
|
+- 4 sigma
|
99,9937
|
63
|
|
+- 5 sigma
|
99,999943
|
0,57
|
|
+- 6 sigma
|
99,999998
|
0,002
|
In reality, a process can drift (or shift) 1,5 sigma in either direction.
A process could indeed be capable of producing a near perfect output (Short Term Capability of 6 Sigma - also known as Process Entitlement).
The difference between the "best" a process can be, measured by Short Term Process Capability, and the customer's aggregate experience (Long Term Capability), is known as Shift, called Zshift or σshift.
For a "typical" process, the value of Zshift is 1,5 sigma.
When we talk of "6 Sigma," inherent in the definition is that the Short Term Capability of the process is 6 sigma, the Long Term Capability is actually 4.5 sigma.
With a typical Zshift of 1,5 sigma, the residual defectiveness is 3,4 ppm, which is the target achievement of the 6 Sigma methodology.
In a 3 sigma world:
- No computer would work
- 54.000 cheques would be lost each night by a single large bank
- there would be many short or long landing at most airport every day
It's easy to realise that the modern world requires much more than the traditional 3sigma level
With a high enough value of Process Sigma, the process approaches zero variation - this is known as zero defects.
why six sigma?
Because in a process consisting of several steps, the overall Process Yield is the product of the yields of the different steps.
For instance, for a simple process consisting of 2 steps, where step 1 had a yield of 80% and step 2 had a yield of 90%, the overall process yield would be 80% x 90% = 72%.
So, the overall yield of a process involving a number of steps is always less than the yield of the step carrying the lowest yield.
If three sigma quality levels (99,97% yield) are obtained from every step in a 10-step process, the quality level at the end of the process will contain 26.674 defects per million!
the approach to improvement of processes - DMAIC
DMAIC is an acronym for five interconnected phases, typical of every 6 sigma project:
Define - Measure - Analyse - Improve - Control
Each step in the cyclical DMAIC Process is required to ensure the best possible results.
- DEFINE:
Define the Customer, their Critical to Quality (CTQ) issues, and the Core Business Process involved.
Define who customers are, what their requirements are for products and services, and what their expectations are.
Define project boundaries: the stop and start of the process.
Define the process to be improved by mapping the process flow.
Develop Project Plan and Milestones.
Tools:
Project Charter - Process Flowchart - SIPOC Diagram - Stakeholder Analysis - Work Breakdown Structure - CTQ Definitions - Voice of the Customer Gathering Tools (QFD)
- MEASURE:
Measure the performance of the Core Business Process involved.
Develop a data collection plan for the process.
Collect data from many sources to determine types of defects and metrics.
Compare to customer survey results to determine shortfall.
Define Defect, Opportunity, Unit and Metrics.
Tools:
Process Flowchart - Data Collection Plan - Benchmarking - Measurement System Analysis - Voice of the Customer Gathering Tools - Process Sigma Calculation
- ANALYSE:
Analyse the data collected and process map to determine root causes of defects and opportunities for improvement.
Identify Value Adding/Non-Value Adding Process Steps.
Identify Sources of Variation.
Identify gaps between current performance and goal performance.
Prioritise opportunities to improve.
Tools:
Histogram - Pareto Chart - Scatter Plot - Regression Analysis - Cause and Effect/Fishbone Diagram - 5 Whys - Process Map Review and Analysis - Statistical Analysis Hypothesis - Testing (Continuous and Discrete) - Non-Normal Data Analysis
- IMPROVE:
Improve the target process by designing creative solutions to fix and prevent problems and eliminate defects.
Assess Failure Modes of Potential Solutions.
Validate Potential Improvement by Pilot Studies.
Create innovative solutions using technology and discipline.
Develop and deploy implementation plan.
Tools:
Brainstorming - Mistake Proofing (Poka-Yoke) - Pugh Matrix - House of Quality - Failure Modes and Effects Analysis (FMEA) - Simulation Software
- CONTROL:
Control the improvements to keep the process on the new course.
Prevent reverting back to the "old way".
Require the development, documentation and implementation of an ongoing monitoring plan.
Institutionalize the improvements through the modification of systems and structures (staffing, training, incentives).
Verify Benefits, Cost Savings, Profit Growth - celebrate!
Tools:
Process Sigma Calculation - Control Charts (Variable and Attribute) - Cost Savings Calculations - Control Plan
example of practical application of the six sigma approach
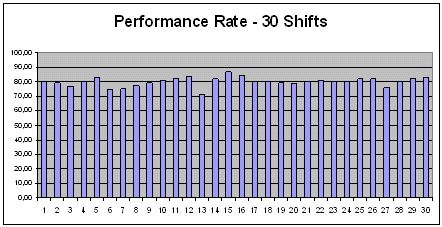
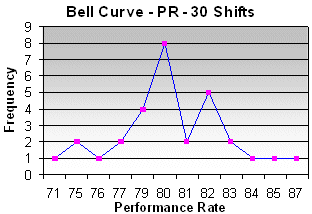
The Performance Rate of a production machine is kept under close control. The target imposed by Production Management is to achieve an average PR of 80%.
During the last 30 Shifts the following PR were obtained:
80,20 - 79,30 - 76,80 - 80,00 - 82,80 - 74,80 - 75,00 - 77,30 - 79,10 - 80,80 - 82,20 - 83,80 - 71,00 - 82,00 - 86,90 - 84,80 - 80,00 - 80,20 - 79,00 - 78,80 - 79,90 - 80,80 - 80,10 - 80,00 - 81,80 - 81,90 - 75,90 - 79,90 - 82,10 - 83,00
The average PR is 80,0067. So, the target is achieved.
If, however, Production Management would impose a new target: PR not to fall below 79%, and a Six Sigma analysis was made, one would discover that 7 Shifts failed to achieve the set target:
80,20 - 79,30 - 76,80 - 80,00 - 82,80 - 74,80 - 75,00 - 77,30 - 79,10 - 80,80 - 82,20 - 83,80 - 71,00 - 82,00 - 86,90 - 84,80 - 80,00 - 80,20 - 79,00 - 78,80 - 79,90 - 80,80 - 80,10 - 80,00 - 81,80 - 81,90 - 75,90 - 79,90 - 82,10 - 83,00
This would lead to a DMAIC action directed to discover the causes of poor performance during the 7 Shifts and their subsequent elimination.
six sigma methodology - remarks
The above is a simple and concise presentation of the Six Sigma methodology.
There are some remarks to be made:
- There is a strong argument in industry about which is the best approach today to performance improvement. Many gurus state that the path to follow is the lean path. Many others pretend that the best path to follow is the Six Sigma path.
Such a debate should not exist. The two approaches are not antithetic, but complementary.
Lean is first of all a philosophy and a direction, and the lean status is achievable by deploying a number of "lean" disciplines in an integrated fashion.
Six Sigma is one of such "lean" disciplines, and remains only a discipline and a methodology.
The primary target for industry today is value enhancement and parallel elimination of waste. The 0 defects Six Sigma target is just a part of the overall target!
- When a process (any process) is subject to considerable variability (for whatever reasons), the 6 Sigma methodology is probably the best and most effective tool to stabilise it and bring it under control.
In extreme situations (very high variability), nothing beats 6 Sigma!
- However, the 6 Sigma approach generally requires high efforts, long times, specialised personnel (the famous "black-belts" and "green-belts"), considerable experience/practice, sophisticated statistical calculations, etc.
That's why it should be reserved for "extreme" situations.
- In situations that can be tackled using the typical "lean" tools (from Creative Problem Solving, to 5Why, to TPM tools, to Poka-Yoke methods....) one should think twice before embarking into a Six Sigma project. Many processes, also subject to high variability, can be "poka-yoked", at a fraction of the time and efforts required for an equivalent 6 Sigma result.
|


