|
navigation
consulting
services
training
services
specials
reading
material
resources
|
Many Manufacturing Enterprises are willing to undergo the "lean" road. Many enterprises make a formal decision in this respect.
However, many enterprises just don't get there: their "lean" project gets somehow stuck midway and even at the very beginning - momentum decays or even gets lost altogether - the "lean" project gets postponed, delayed and even rescheduled indefinitely. Why?
Because either the direction, the "lean" direction is not clear - or, even when it's rather clear, they cannot set priorities and produce a formal, comprehensive plan of action.
People gets confused on priorities: what comes first, second and third is vague or blurred - and all constraints associated with a lean initiative are not properly identified and understood.
For instance, in order to link 2 processing stations close together and establish continuous flow (more ») between them may require that the set-up time of the first processing station be reduced considerably. If this is overlooked, the flow initiative fails and people start blaming the lean philosophy and go back to the old method....
Or, for instance, it may be necessary to achieve a much higher OTDR (On-Time-Delivery-Rate, or degree of reliability) at the first processing station. If some TPM (more ») and Autonomous Maintenance practices are not deployed first at processing station 1 in order to increase its OTDR, the flow will go banana very soon, with similar back-fire results and return to the old method.....
Episodes like the above happen very frequently: what lacks is a central "lean" plan, a comprehensive plan that links ALL necessary lean initiatives, highlighting all constraints and setting all necessary priorities.
This is where Value Stream Management and its operational arm, Value Stream Mapping, come to the rescue.
Descending from Value Adding Management (more ») and Process Engineering (more »), Value Stream Management (VSM) is a discipline for planning, linking, integrating and co-ordinating "lean" initiatives. This is done operationally by deploying the Value Stream Mapping technique, that calls for systematic data collection and analysis.
VSM PRIMARY TARGET
Manufacturing lead-time (throughput time) reduction through waste elimination.
How?
Understanding/analysing Flow of Materials and Flow of Information along the selected Value Stream/s.
To become effective, VSM must be understood, supported and driven by Top Management - and understood/known operationally by Managers, Supervisors, Team Leaders and key frontline personnel.
Besides representing a fantastic tool for the operations/improvement groups - who need practical techniques for understanding their operational system and for planning/prioritising lean initiatives - VSM is also a super tool for Top Management, who need to know and "touch" the benefits associated with a lean project.
The common tool for both is the Value Stream Mapping "storyboard", a poster size framework holding all key data for planning lean initiatives.
The Value Stream Mapping approach
There are 9 major steps in a Value Stream Mapping exercise:
- A] Strong commitment to lean
- B] Identify, select and choose Value Streams (per product or class of products)
- C] Learn lean practices
- D] Current State Mapping
- E] Determine applicable metrics
- F] Future State Mapping
- G] Set Kaizen-style Lean Improvement Plans
- H] Implement Improvement Plans
- I] Monitor
One-by-one:
A] STRONG COMMITMENT TO LEAN
This the most critical and delicate step in the path to "lean".
Enterprise's Top Management must be fully knowledgeable and fully committed to lean. It's the usual "big-bang", without which nothing will happen: if Top Management delegates the lean project and leaves it in the hand of a senior manager (possibly the Operations or Production Manager), it is likely that the project will end up into marginal and even spurious improvement.
Top Management must:
- be exposed to comprehensive principles of Lean Manufacturing
- understand its constraints and implications
- understand the need for strong people commitment and involvement
- understand there is no easy shortcut to lean
- never confuse a lean exercise with a cost-cutting exercise
- understand that the lean project must be top-driven, supported and monitored in all its stages
If the above requirements are not verified, the lean projects limbs and sooner or later will show its deficiencies.
To the purpose, Top Management must undergo formal Lean Manufacturing and Value Stream Management training. In this regard, all the times I am asked to deliver in-house Lean Manufacturing training courses I set a pre-requisite and insist that Top Management will be attending full-time. Finito.
Generally, a well convinced and committed Top Management will make, sooner or later (the sooner the better), a simple but very loud declaration to all people in the enterprise. This generally includes a formal announcement that the enterprise is now going into the lean direction - that everybody in the enterprise will be formally trained in the use of lean tools and made aware of the lean benefits, constraints and implications - that everybody in the enterprise will be requested to participate actively in the lean project - that everybody is most welcome to remain on board the boat now going lean, and to contribute to row in the desired direction - that this, however, is not compulsory: it is well possible that someone will not like the "lean philosophy"; in which case those "someone" will not be compelled to remain on board - but must be well clear that the direction is now set, it is irrevocable and definite: there is no come back.
This is the starting point of a viable lean project. The lean road may be very long and strenuous: everybody must be prepared to the long travel.....
Another critical move during this initial step is the appointment of a Lean Project Manager (LPM). Top Management must identify one senior manager who will be in full charge of the Lean Project, fully responsible for it, and fully accountable to Top Management in its regard.
It is important to point out that this is not a simple delegation: the appointed LPM will report regularly to Top Management in strict liaison and Top Management will always be the driver of the Lean Project.
However it is essential to appoint such person, as the complexity of a Value Stream Mapping exercise must be dealt with and well co-ordinated by a person with all typical features of a Project Manager: good thinker, good planner, good communicator, good team leader, good co-ordinator, good administrator, etc.
Who should such person be?
A senior manager, with considerable authority, and not necessarily from Production or Operations. The lean PM may well be one director of the enterprise or a member of Top Management. What is essential is that the person has good Project Management knowledge and abilities. That's all.
During this initial step, the Lean Project Manager (LPM) will also appoint his "primary" VSM Team, comprising members from all main functional areas (Production, Quality, Maintenance, Engineering, Procurement.....).
Now things are ripe for step 2.
B] IDENTIFY, SELECT AND CHOOSE VALUE STREAMS
An enterprise may manufacture one product only, or several products, or a range of similar products, or some or many ranges of products.
What is a value stream?
A value stream is defined as that sequence of processing activities that produce as an output a product or range of products (or service/s, or both). A value stream is a process, the entire process required to produce a product or range of products, including all its processing stations, manufacturing lines, etc.
It begins in the incoming raw materials area, and ends at the product/s despatching area.
However, under the VSM angle of view, a value stream begins at supplier's premises and ends at client/s' premises.
REMARKS
An operational, manufacturing process may be not value-streaming at all, i.e. it might be so "traditional" (batch/push) and so full of waste that it flows very little or even doesn't flow at all like a stream should. It is the task of the VSM exercise to make it flowing and value-generating, e.g. "lean".
One of the primary tasks of the VSM Team, co-ordinated by the LPM is to select one or more value streams on which the VSM technique will be deployed.
How many?
It depends by the policy set by Top Management - by practical constraints - by common sense.
In a SME it may be rather easy to deploy a VSM exercise over the entire range of value streams. In a larger and more complex enterprise it may be impossible, or un-justified, or excessive.
Considering the difficulties and required energies/resources associated with a VSM exercise, either the VSM Team, or Top Management, or both may decide to rationalise things and focus initially only on one or few value streams, possibly those related to the most popular/fast selling products or range of products, and leave other value streams for a future time.
The selection of one or more value streams is critical, as a VSM exercise MUST be a successful exercise: no failure is possible, or the Lean Project may suffer indefinitely.
Once value stream/s are selected, the VSM Team can start planning the subsequent step/s.
This includes: identifying all personnel related/associated to the selected value stream/s - grouping/structuring them in a number of sub-teams, all co-ordinated by sub-LPMs - planning adequate Lean Manufacturing training for all of them.
This is also critical.
A VSM exercise will succeed only if those concerned in each operational area of the value stream will fully participate in the VSM exercise (bottom-up, but top-driven/co-ordinated) and will get actively involved and committed.
This means all concerned personnel will have to be exposed to Lean practices - gradually buy-in the lean concept - and gradually shift culturally from traditional mentalities to a leaner way of thinking.
This requires gradualism, although deploying Lean practices actually create higher involvement and contribute rather fast to the necessary cultural change.
Planning adequately this part of the VSM approach can definitely be rather delicate in many "traditional" enterprises.
C] LEARN LEAN PRACTICES
This is the education and training stage, both formal and informal training.
A well planned Lean training program will include: awareness generation/sensitisation to identification/elimination of waste - a rather comprehensive presentation of lean benefits, limitations, constraints and implications - an initial, broad presentation of the available lean disciplines and their areas of deployment - illustration of practical VSM procedures and tools - tips on how to generate and maintain the "lean momentum".
A train-the-trainers program should also be included, so that formal and on-the-job training can regularly take place in a top-down style over the planned period of time (and subsequently, indefinitely.....).
Who must be trained?
ALL THOSE CONCERNED, at all levels. Finito.
Timing: not forgetting that the factory cannot stop its operations, adequate time should be allowed for the learning process to take place and penetrate sufficiently. No fixed rule can however be set.
The subsequent step may start either at the end of this phase, or even before (while the education/training process still goes on).
D] MAP CURRENT STATE
As stated before, the main VSM tool is the so-called storyboard.
This is a wall-poster (very large for complex value streams, up tp occupying a large wall) subdivided into 2 main areas:
- the Current State Map (normally on the left-hand side of the poster)
- the Future State Map (normally on the right-hand-hand side of the poster)
Normally, at the bottom of the poster, there is an area reserved for "metrics" (current and future metrics - see below).
There are a preliminary step and a number of operational steps to map the current state.
PRELIMINARY STEP
Round-the-table Team work. The LPM re-defines the Project - highlights the reasons for selecting the chosen value stream/s - re-explains briefly the VSM approach/procedures - re-defines the operational Teams appointed for the task - sets time-frames - and assigns duties to the co-ordinators (sub-PM) of the operational Teams.
OPERATIONAL STEPS
The various operational Teams get into action. The action (not necessarily in logic sequence):
- Map the Process (Arrow Diagram tool).
This step, generally, is not included in typical VSM exercises. I strongly recommend it (see reasons below).
It consists in identifying all Processing Components (both Value-adding AND non-Value-adding) in the selected value stream process and map the process to scale - all physical constraints (pillars, walls, etc.) as well as any difference of floor level must be indicated.
There are 4 major process components:
RETENTION - CONVEYANCE (transportation) - PROCESSING (Value Adding?) - INSPECTION
A Process Map produced with the Arrow Diagram tool will look something like this:
Please note: no physical constraints (pillars, walls, etc.) are shown in the above diagram (for simplicity).
Why it is so important to Map the Process with the Arrow Diagram? For 2 main reasons:
- Because it open the doors to Process Razing and Group Technology studies, extremely useful when drawing the Future State Map (see below)
- Because, having illustrated all physical constraints may come extremely useful during Future State Mapping to identify both criticalities (obstacles to layout changes - like the presence of a pillar or an un-breakable wall) and opportunities (like a difference in floor level that may come useful for "gravity" conveying of materials or work-in-process)
- Preliminary drafting of the Current State. Using the icons suggested by VSM gurus (or using your own), schematically draw the identified Value Stream Processing Stations - BUT starting from Supplier/s and ending with Client/s - in the Current State area. Follow a "timeline" (left to right) to show sequence. The Current State area will look something like this:
Note: attached to each Processing Station icon there is a data box (which must then be filled with data). A similar one is drawn next to Supplier and Client icons. Also a data box regarding the entire process is positioned in the Current State area.
The schematic diagram drawn represents the Flow of Materials for that Value Stream.
- Now the Data Collection step may begin. The first stage consists in collecting data regarding the Flow of Materials.
Operations must be documented with relevant data. Which data?
No fixed rule exists. The VSM Teams will have to identify the most significant data for each Processing Station AND for the entire Process. Moreover, all significant data regarding supplies from Supplier/s and despatches to Client/s must be documented too. All collected data then are inserted in the respective data boxes. As a guideline:
FOR EACH PROCESSING STATION
- Total time per shift
- Planned Downtime
- Preventive Maintenance Schedules
- Change-Over time
- Actual available daily production time
- Overall Equipment Effectiveness (3 rates)
- Uptime
- Delivery/despatch schedules (per day/week/month)
- Economic Lot size (if any) and actual Lot size
- N. of items per despatch container
- Cycle Time (and VA Time, if different!)
- WIP
- Number of operators
- Typical Line/Machine speed
- and any other significant parameter
FOR THE ENTIRE PROCESS
- Total time per shift
- Planned Downtime
- Preventive Maintenance Schedules
- Change-Over time
- Actual available daily production time
- Overall Equipment Effectiveness (3 rates)
- Uptime (average)
- Delivery/despatch schedules (per day/week/month)
- Economic Lot size (if any) and actual Lot size
- Any typical/recurring/significant disruption in the Flow
- Overall number of Operators (including services and logistics)
- Throughput Time (overall)
- and any other significant parameter
FOR SUPPLIER/S
- Descriptions and typical supplied quantities for every supplied critical material lot
- Frequency of despatches (typical)
- Lead time
- "Punctuality" (OTDR) rate
- QC on acceptance specs.
- Typical rejects, non-conformities, or defective PPM (parts per million)
- Release to production specs (if any) - quarantine specs (if any)
- Sizes of typical lots released to production
- Etc.
FOR CLIENT/S
- Customer/s requirements per product (monthly, weekly....)
- Delivery/despatch actual (recorded) frequency
- Delivery/despatch actual lot size (typical, average.....)
- "Punctuality" (OTDR) rate
- Typical rejects, non-conformities, or defective PPM actually ascertained by client/s
- Etc.
As integral part of this step, also data regarding the "what happens between Processing Stations" and "between Supplier/s and Processing Station 1" and "between last Processing Station and Client/s" must be collected and documented.
The main data required are (but not limited to) the following:
- Method of transmission of materials between: Supplier/s and Processing Station 1 - between the various Processing Stations - between Last Processing Station and Client/s. This may be: a PUSH method - a PULL method - a hybrid method.
- Inventory/WIP (work-in-progress) at the same points as above
The relevant data may be inserted in data boxes or, better, between Processing Stations. VSM icons may be used, or invent your own. The Current State Map will look something like this:
Also the total Days of Inventory/WIP on hand should be calculated and entered in the Process Data Box.
The Time Line in the lower part of the Current State Map may be conveniently used to show significant time-related data, such as:
- overall typical or average time to process at each Processing Station
- typical/average time gap between Processing Stations
- etc.
Times may be expressed in hours, days or weeks, as the case may be.
The Time Line may look like this:
It's now time to start investigating the Flow of Information in the Current State, the second stage of Data Collection.
Target: identify all relevant data regarding information flow for the selected Value Stream/s between:
- Client/s and Enterprise
- Enterprise and Supplier/s
- within the Enterprise: to Production Management, Planning and Scheduling
The mechanism, specific to every Enterprise and referring to the selected Value Stream, is something like this:
- Clients transmit orders to the Enterprise for the concerned products
- Clients' orders are processed "somewhere", converting them into:
- Orders to Production
- Orders to Suppliers
- Orders to Production are processed further and converted into Production Plans
- Production Plans get analysed further and converted into detailed Production Schedules
- Production Schedules (weekly/daily) get transmitted to the various Processing Stations
The VSM Team/s must therefore investigate thoroughly the mechanism above, extracting significant data out of it, and document it schematically in the Current State Map.
Two essential "units" must be investigated:
- The let's call it Central Processing Unit
- And the let's call it Production Planning/Control Unit
The associated, schematic representation in the Current State Map may look something like this:
Please note the various data boxes positioned: next to Central Processing (Central Processing Unit data) - between Client/s and Central Processing Unit (Client/s orders placing data) - between Central Processing Unit and Supplier/s (orders to Supplier/s placing data) - between Central Processing Unit and Production Planning/Control (data regarding transmissions of Production Orders to Production Planning) - next to Production Planning/Control (data regarding this Unit) - between Production Planning/Control and Processing Stations (via Production Supervision if applicable) (data regarding transmission of Production Plans and Schedules to Processing Stations).
Which are the significant data to be collected and documented?
Again, no fixed rule exists, as it varies case by case. As a guideline:
- Frequency of transmission of information (between the various concerned units)
- Means of transmission/documentation (paper, fax, electronically.....)
- Manning (number of persons) required for processing information
- Production Planning features (MRP, MRPII, Kanban.....)
- Typical hiccups, delays and mishaps (entity, frequency......)
- Typical lead times at all information processing steps
- Any other significant data
Eventually, all data regarding the flow of information are collected and documented in the Current State Map. The target is simple (but difficult to achieve):
Know in sufficient details and with sufficient clarity how the information mechanism works, so that all concerned entities (Suppliers and Processing Stations) know what to do, when to do it, and how.
The Data Collection step is the most delicate and at the same time the most energy-consuming part of the VSM exercise.
Yet it is vital not only to draw the Current State Map, but primarily to enable all those concerned to know (finally!) how the Current System of Operation works!
It demands the involvement of several VSM Teams and may require long time to be completed accurately.
It is extremely important to collect and document only significant data, but ALL significant data (those that may impact the design of the future, lean state) must be collected and documented.
While the collected data start flocking into the VSM Control Room (where the storyboard is located), they are verified and then inserted in the relevant data boxes.
Eventually also this step is completed. The Current State Map is checked and verified in great detail, and gets finally approved by the LPM.
E] DETERMINE APPLICABLE METRICS
This is another very important step.
The Current State Map just produced is an excellent, operational tool to understand and analyse in detail the present state of affairs (the Future State Map will have a similar purpose).
Therefore it is a vital tool for the VSM Teams, a tool that enables their members to trace important operational details at any time they may be required.
However, in order to compare (eventually) the present state of affairs with a proposed, future, leaner one, details are not so important, especially for Top Management.
What is required is indices: few, global and meaningful.
That's why this step becomes so important.
During this step of the VSM exercise, the primary VSM Team (the one lead directly by the LPM) identifies and defines the system metrics, synthetic indices describing broadly but effectively the system "performance".
What indices? what metrics? Here a few rules can be given. The recommended indices should include:
- The Total Cycle Time
- The ΣVA-Time (Sum Value-Adding Time)
- The Throughput Time
- The main "lean" index: ΣVA-Time / Throughput Time
- Defective Parts per Million (DPPP) - or Sigma Level
- Overall Equipment Effectiveness
- Inventory turns
- Days of inventory on-hand
- Total Process' WIP
- Uptime rate
- On-time Delivery (OTD) Index
They are sufficient to assess the System Performance (actually, the main "lean" index alone gives already a rather good indication of the System Performance).
However, it is up to the primary VSM Team to identify the necessary System Metrics, agree upon them, and document them in the pertinent area (the lower area of the VS Map).
This area should be conveniently subdivided to display:
- The Current State Metrics
- The Future State Metrics
- The proposed System Performance Improvement
and may look like this:
Now the power of the VSM exercise starts appearing: once the Future State will be mapped and the corresponding, proposed metrics will be identified, it will be possible to compare thoroughly the 2 states, and assess the improvements that will be achieved if the Future State plan will be implemented!
Top Management will definitely have lots of food for thoughts....
F] MAP THE FUTURE STATE
This step is implemented by the various VSM Teams by deploying:
- Their "lean" know-how
- Creative Thinking
After reviewing the Current State Map, the LPM assigns tasks to the various VSM Teams. The goal:
Produce a proposed, Future State Map that will be "leaner" than the present one (as lean as possible), bringing up a number of Kaizen-style Improvement Projects suited to the circumstance.
The real targets are:
- Continuous Flow
- Pulled by the Client/s
- With as little residual waste as possible
- With the shortest possible Troughput Time
- Maximising the main "lean" index: ΣVA-Time / Throughput Time
NB: Targets must be realistic BUT challenging - and, there must be "universal" consensus on the targets finally set.
No fixed procedure exists, as things vary case by case. The following is a possible guideline, in stages:
- Draw icons representing Client/s, Supplier/s, Central Processing Unit and Production Planning/Control Unit, something like this:
Insert Data boxes for subsequent use.
- Now focus on the "demand" side: the Customer comes first. Try to give answers to a lot of questions:
- What is the demand?
- What is the TAKT TIME?
- Are you over-producing, under-producing or meeting the demand?
- Can you meet the TAKT TIME (or the OPERATIONAL TAKT TIME, or the PITCH) with the current Production Capacity/facilities?
- Do you need BUFFER STOCK? Where? How much?
- Do you need SAFETY STOCK? Where? How much?
- Will you need a FINISHED GOODS SUPERMARKET?
- And what LEAN IMPROVEMENTS will you need to improve your ability to meet the required TAKT TIME?
Do not go into micro-details of the "future" state at this stage - this will come later.
But if the preliminary conclusion is that you need (temporarily) BUFFER STOCK, and/or SAFETY STOCK and/or FG SUPERMARKET, draw some corresponding icons in the Map, for instance:
- Start thinking of which basic "Lean" Disciplines/Techniques you are going to adopt at "which" Processing Stations.
These may include, for instance: SOCO (more ») - AQCO (more ») - Autonomous Maintenance and other TPM (more ») tools.
The deployment of the above Disciplines (or others) may have resulted obvious and necessary when producing the Current State Map. So this is an essential item to be considered.
- Determine which Quality Improvement Technique/s you are going to adopt for improving drastically the output quality of critical Processing Stations. For instance: TQM (more ») techniques - "in-process" Quality Control/Assurance performed by Operators - SPC - 6 Sigma (more ») - 0 defects/Poka Yoke tools (more ») - 100% Quality Testing - etc.
The deployment of the above Techniques (or others) may have resulted obvious and necessary when producing the Current State Map. So this is an essential item to be considered.
- Now focus on "Flow". The target: Continuous Flow. This means that each next downstream Processing Station receives from upstream:
- Only those work-pieces that are needed
- Just when they are needed
- In the exact amount needed
- With the needed level of Quality
Brainstorming: which "Lean Flow" Techniques can you conveniently deploy at which Processing Station/s to enhance FLOW and PULL? A number of questions need to be answered:
- Where can you apply "continuous flow"?
- Can you go for "one-piece flow" in a number of adjacent Processing Stations?
- Can you reduce considerably the "lot size" in a number of adjacent Processing Stations?
- Can you introduce U-Cells (more ») to replace a number of adjacent Processing Stations?
- Can you bring closer and join together two or more adjacent Processing Stations?
- Can you integrate any multi-process Station/Line?
- Can you eliminate altogether (any) redundant Processing Stations?
- Can you apply "Process Razing" and "Group Technology" techniques to group together a number of adjacent Processing Stations?
- This is where the previously drawn Process Map (using the Arrow Diagram tool) comes handy.
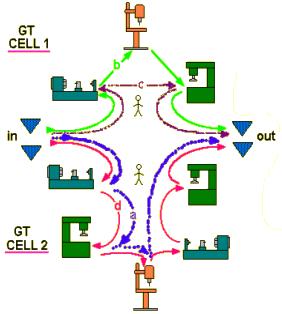
Let's give an example of utilisation of the Process Razing/Group Technology technique, considering this simple layout:
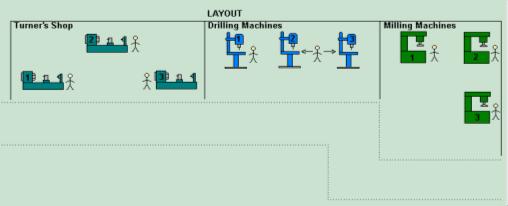
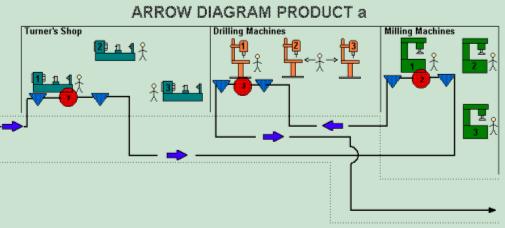
Now let's consider the Arrow Diagram of Product a (one the 4 products produced in the selected Value Stream):
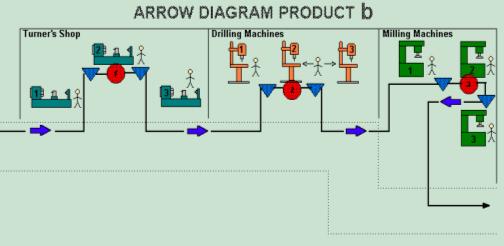
And of Product b:
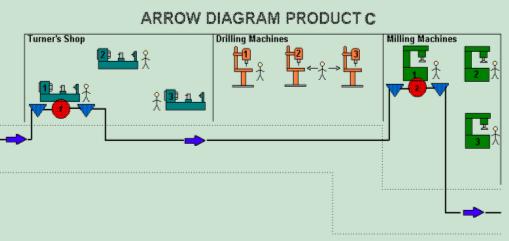
And of Product c:
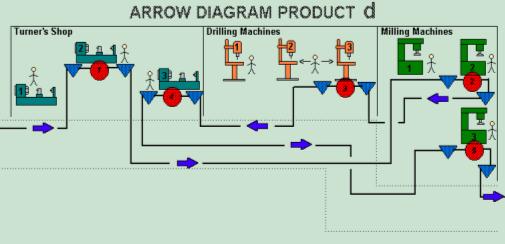
And of Product d:
Now let's see the schematic "routing" of the 4 Products through the various Processing Stations:
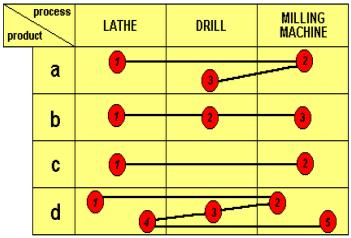
Note: if machines belonging to the same category (i.e. Lathes) differ (in size, capacity, speed, features....), then a separate column should be made for each machine.
With this analysis, the VSM Team tackling this particular area of the Future State may conclude that it is possible to establish "Flow Processing" by means of 2 Group Technology Cells (GT Cells): the first to handle processing of Products b and c, and the second to handle processing of Products a and d - each manned by a multi-skill/multi-function operator, as per scheme:
-
Brainstorming: Is there any physical constraint or limitation imposed by the factory layout (refer to Process Mapping)? On the other hand, is there any hidden opportunity arising from the factory layout that can be exploited?
With regard to opportunities: gravity is a fantastic allied in manufacturing. This force is readily available everywhere, is abundant and free-of-charge.
Where and how can the force of gravity be used in the future state, f.i. to convey materials/workpieces from one Processing Station to the next, thus establishing continuous flow?
-
Brainstorming: How will you then control upstream production: KANBAN (more ») - pure PULL/FLOW - IN-PROCESS SUPERMARKETS - or traditional MRP?
Answers must be given. The real challenge is to try to go for pure PULL/FLOW all along the future value stream, if at all possible.
-
Carefully study the "future state" Line Balancing. LINE BALANCING is the method by which work elements for that product/range of products are evenly distributed at each Processing Station all along the entire Manufacturing Process in order to meet TAKT TIME.
No fixed rule, valid in all manufacturing circumstances, exists:
- New, proposed cycle-times need to be analysed very carefully
- Micro-Waste inherent in actual "value-adding" processing operations may need to be eliminated in order to minimise their cycle-time
- Some machines may need to be slowed down (to prevent over-production)
- Some machines may need to be speeded-up through TPM methods or even more drastic interventions (to prevent under-production)
- Operators' work may require balancing (to prevent under-busy or over-busy situations)
- Operators' work may need to be standardised (in order to achieve an even level of performance from different operators)
- The number of operators required at and between Processing Stations needs to be assessed realistically - the overall Operators' work must be balanced and synchronised.
-
NB: Do not attempt to study the "future" flow of information at this stage - only focus on flow of materials.
-
Draw, in subsequent, experimental steps the future state map. Continuous brainstorming/debating may be required.
Display:
- Processing Stations/lines that will remain un-altered
- Adjacent Processing Stations that are going to be re-arranged in Cell shape
- Adjacent Processing Stations that are going to be "joined" physically or re-laid out to become much closer to each other
- Processing Stations that are going to be eliminated (such as "external" QC stations) do not need to be displayed.
-
Draw, next to each "future" Processing Station, the lean improvement method needed to actually implement it (such as AQCO - TPM - Cell - etc.) using the "cloud" icon or any icon of your choice.
-
Attach to each "future" Processing Station the respective Data Box showing the new, significant Attributes as extrapolated by the Team/s (Cycle Time - Available Time - Overall Uptime - Change-Over Time - OEE - Operators' icons - etc.).
-
Think of how you are going to set PRODUCTION LEVELLING [over a day or a shift: even distribution of work-load required to meet customer demand within the various Processing Station so that no one will fall behind (overloaded) and no one will be under-utilised (idling)]: Continuous Flow? Kanban? Paced Withdrawal? Heijunka Box system?
After which, the Flow of Materials part of the Future State Map should take shape. It may look something like this:
You may note:
- The lean disciplines the VSM Team/s have decided to adopt in order to transform the relevant Processing Stations into a more flowing and pull system
- The envisaged possibility of introducing "supermarkets" (buffer and safety stock) between Processing Stations. This may be a temporary measure, until the Future system stabilises
- The future "timeline" showing drastic improvement both in cycle times and in throughput time
-
Draw the Flow of Information (electronic and manual): to/from Customer/Supplier - to/from Production Planning/Control from/to Processing Stations (include Production Supervisors' boxes in between as required).
In a much leaner and pull system, such as the one in the example, the Flow of Information between the Planning/Control Unit and the Processing Stations becomes extremely simple: information on orders to be produced are transmitted to the most downstream Station (4/5/6 in the example) and simultaneously to the others. The entire system then gets into motion in a pull style, and the continuous flow gets established.
In this exercise also the entire Planning/Control Unit may get totally "re-engineered" to suit the new system, as well as the Central Processing Unit.
In a "lean" system no functional area remains untouched!
For simplicity, no Flow of Information lines are drawn in the example scheme.
-
Review the Future State Map - touch-up, perfect as necessary - enter the final version in the storyboard.
-
For each "Metrics" parameter in the "Current State Map", define/calculate the corresponding one for the "Future State Map", and enter in the storyboard. Compare.
G] SET KAIZEN-STYLE LEAN IMPROVEMENT PLANS
After the final review of the "Future State Map", the real Improvement stage begins.
Kaizen projects, fit to implement to proposed "Future State" Map, must now be generated.
This is where the VSM exercise produces the most valuable results: because the VSM Teams now have on hand all what is required to get to the Future State system.
All data are available. The systems (present and future) are no mystery. The "direction" (the lean direction) is clear. All is clear. The target is appealing and challenging at the same time.
What is missing are two main items:
- A complete list of what needs to be done to get there
- In what sequence (what comes first, and second, and third......)
The complete list of "things-to-be-done" is rather easy to produce. The thinking power released during the previous steps has done the trick.
Technical issues (training issues, layout issues, etc.) - organisational issues - physical issues (physical layout constraints to overcome as well as opportunities to be exploited, machinery to be moved, etc.) - all have already been debated before and during approval of the Future State Map.
That improvement list can easily be produced.
A bit more complex is prioritising activities and establishing their logical sequence, as well as estimating durations and cost impact of the improvement activities that need to be carried out.
Whereas the "who-is-going-to-be-in-charge-of-what" is not too difficult to identify, as all Team/s members by now know each other very well and have assessed their respective abilities and competencies.
More thinking will be necessary, but eventually a "Lean Master Plan" can be produced.
How does it look like? Something like this:
Wow, what a beauty! All what is to be done, when, for how long, in what sequence, lead by whom, costing how much, etc. etc. All is there!
This is a true Kaizen-style Plan. What a difference from the "traditional improvement list" - maybe resulting from a "suggestion box" scheme; that meaningless list of items to be improved at 360° looking like this
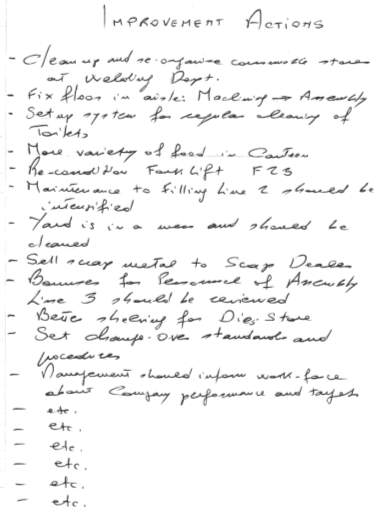
and leading nowhere! (no direction, no priorities, no sequence, no nothing.....). No wonder many Kaizen projects have miserably failed.....
The Lean Master Plan is a true Kaizen Plan and works wonders!
Also the Lean Master Plan, once reviewed and approved, gets posted next to the Storyboard.
There is a final job for the VSM Primary Team: the plan of the future is ready, but to become operational must also please Top Management, isn't it?
Easy: the comparison between old metrics and new, proposed metrics is there. The benefits can be quantified. Some are straight-forward calculations: it's easy to assess the saving corresponding to a defectiveness reduction of x% or the saving related to an improvement in OEE or OTDR of y%. Possibly the calculation of the benefits associated with an improvement in Throughput Time of z% is not as easy: because those benefits are the sum of technical savings (easy to quantify) and the economic advantage arising from extra Marketing power (leverage deriving from offering Clients a drastically reduced lead time....). But good, lean, financial people can quantify anything....
So, benefits can be established somehow. The total expenditure associated with the Future State Lean Plan comes out of the Lean Master Plan: a good Plan caters for estimates of ALL costs associated with the required Improvement Projects (including cost of training - cost of new equipment/ancillaries/accessories as well as jigs, tools, etc. - cost of physical layout changes and machinery relocation - cost of new services and logistics - etc.).
So, Top Management now has: total cost and total benefits. What is the resulting ROI?
If reasonably good over a reasonable period of time (and sometimes that ROI can be fantastically good!), Top Management will easily give its final blessing.....
H] IMPLEMENT IMPROVEMENT PLANS
Good project planning is the secret of a good project. If the VSM Team/s have worked well, implementation should be rather smooth.
Surely there will be some hiccup, and it is also possible that the Future State Map will need to be revised. Good VSM Teams will take good care of that...
Question: what is the typical implementation time frame for a Lean Plan?
There is no typical time frame: for simple situations (like in the SME), that might be just a few months. For more complex situations, it may get to 1,5 - 2 - 3 and even 5 years.
BUT, remember: a Lean Project is ongoing! The target is a moving target. There is no end to the lean trip.....
Even after achieving perfectly-lean value streams (utopia), the lean fanaticism may extend side-ways. Where to?
To investigate support processes: engineering, jig/tool area, services (power, compressed air, steam.....) - and product development area, and procurement area, and.....
How much waste hides there?
Lean Thinking (more ») goes far beyond the operations border and tackles the entire enterprise, using actually tools like VSM and others.
I] MONITOR
Co-ordinated by the LPM, the control function takes place all along the Implementation phase: to identify discrepancies and deviations from the master plan - to rectify - generally to assure compliance to the time frame, the budgeted costs, the goodness of the result.
Top Management must be kept informed at all times and should be officially notified of every milestone that has been completed.
FINAL REMARKS
Value Stream Mapping is generally a hard, time and resource consuming exercise.
However, to date, it is the best integration and co-ordination tool for lean initiatives ever invented.
Besides Manufacturing Operations, it can be deployed for any industrial and commercial type of operations and activities: from Construction to Import/Export, from Healthcare to Retailing.
There is no simple shortcut. But, in simpler situations, there are other Lean Thinking (more ») tools that can be deployed, for instance a Spaghetti Diagram (very powerful tool).
|
